right to carry,
restrictions on semi-auto firearms,
NFA weapons,
Castle Doctrine,
and other Misc. items that they go into further detail on. I have heard many, many different "facts" from both sides of the gun rights debate regarding the amount of crime a state has, versus the legality of firearms. Neither side has ever shown me a modicum of evidence for the garbage they spew out of their mouths with regards to this subject... (ahem-TYT and FOX news) Being a skeptic, and a scientist, I decided the only logical thing to do would be to conduct my own research and compile it for all of you readers, gun toting or gun hating, and supply you with the sources I used. So, along with gunsandammo.com, I also used actual FBI crime reports for the year 2013. You can find that here. I decided to use the violent crime data per 100,000 of each state assuming this would give me the most accurate representation.
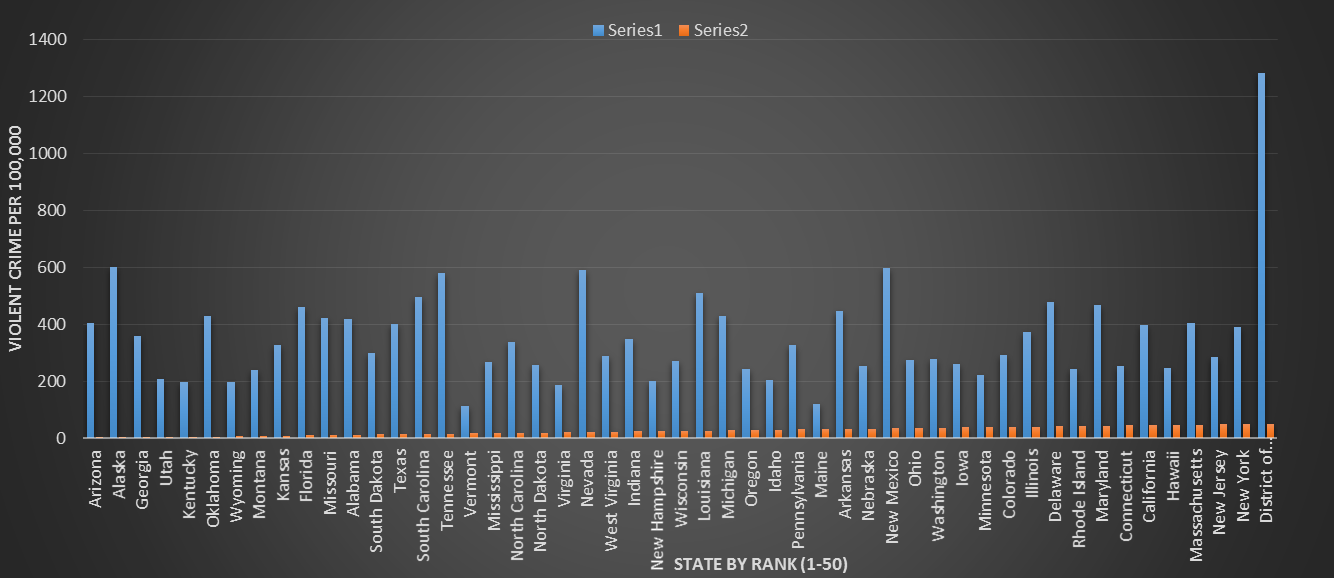
As I was compiling all of my data into excel, I was quite surprised at some of the data. Here is a bar graph that I have created.
 |
| Click to Expand |
As you can see, the Y-axis represents the number corresponding to violent crime in the state per 100,000 residents, per year. The Little red bars you see are simply the states rank, and to further help with visuals, as well as, simplicity, the states are listed from best gun laws, to worst. While graphing I was slightly confused. I was certain that better gun laws would mean lower violent crime rates. I then put the graph into scatter plot form to try and gain insight with the help of a trend line.
 |
| Click to Expand |
This, as you may have guessed, is the exact same graph as we had previously, except this time it is put into scatter plot form, and a trend line is given. A trend line is sort of the average of all the data points. It gives a visual representation of the points versus one another. The trend line increases as the the states are ranked less and less friendly towards firearms. This seems to mean that, overall, there is more violent crime as you go towards the states with the most gun control. I am here to tell you that the graph is most likely this way due to the huge stray point that is Washington D.C.. If this point wasn't so completely out of whack with everything else, I imagine the trend line would jet across that graph in a near perfect horizontal fashion.
In conclusion, according to my research at least, it seems that neither the gun loathers, nor us gun lovers are correct with regards to this issue. All I did was graph the amount of violent crime per state, per 100,000 residents, per year, with the data of most gun friendly states. That is all this shows. It seems to prove there is no direct correlation to speak of. There are a few factors you could look at that may yield better results... such as; concealed carry permit holders versus violent crime. We all know that just because a state has good gun laws, it doesn't mean that everyone is exercising their right to carry and protect themselves. I would imagine that the factor that plays into crime rates the most would be population and poverty level.
If you like this posting feel free to navigate to my other gun postings using the archive feature up below my picture and description. Also, share on Facebook, Twitter, or anywhere else using the buttons to the right, or the link in the navigation bar. I would appreciate any and all feedback as a comment below. If you have any ideas for future posts please let me know. Keep on the lookout for my review on the Yugo NPAP Ak47, the Henry Golden Boy .22LR, the Bear Creek Arsenal AR-15, the Heritage Rough Rider in .22LR and .22 Magnum, and many others to come.
No comments:
Post a Comment